
How to Use Google Analytics Audience Insights to Improve Your Pet Store Marketing
Want to learn more about your audience? Your customers? Your subscribers?
Ready to dig deeper into Google Analytics to find valuable insights?
In this Insider post, we’ll share what data is available in the Google Analytics Audience subsection and how you can use it for your pet store marketing strategy. Ultimately, understanding your audience demographics, behaviors, and interests can help you in your other marketing campaigns through messaging, affiliated content, placements, and even inventory. Let’s get started.
How to Use Google Analytics Audience Data
to Improve Your Marketing
The Audience Dashboard
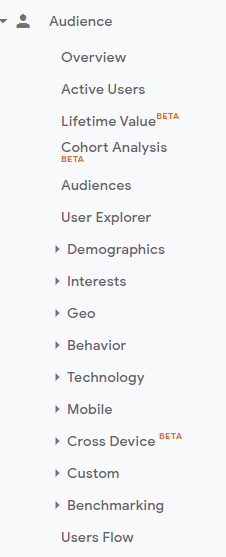
There are 15 primary data pools available to Analytics users…as of the publication of this article! They’re always adding more, and as you can see in the screenshot, Google rolls out Beta features regularly. Here’s a quick description of what data you’ll find in each subsection:
Overview — High-level view of visitor metrics
Active Users — Number of visitors within the last 1 to 30 days
Lifetime Value — Revenue per user after the initial acquisition
Cohort Analysis — Segmenting users based on behavior
Audiences — Segmenting users based on data dimensions
User Explorer — Examine individual, rather than aggregate/collective user behavior
Demographics — Age and gender data of website visitors
Interests — Segments based on interests affinity and marketing categories
Geo — Locations and languages of your visitors
Technology — Browser, operating systems, and networks of your audience
Mobile — Data on the different types of devices used to visit your website
Cross Device — Data to connect seemingly unrelated touchpoints, sessions, and interactions with different devices
Custom — Unique reports, segments, or data defined by you
Benchmarking — Compare your data with other companies or industries
Users Flow — A visual representation of how users move through your website
My first reaction to opening up Analytics was “whoa.” There was a lot going on there. How would I ever learn to use all of it?
The answer? The same way you learn anything else: repetition, focus, enthusiasm, etc, etc. Just have to dive right into it! You can navigate to the particular sections you’re looking for in this article for specific help on a subsection.
Have more questions? Contact us! You can also find some immediate help in our FB Group: Marketing Help for Pet Businesses.
We’ve also got plenty more resources in our Blog section.
1. Overview

Your audience overview tab is your starting point in the Audience dashboard. It shows data on users (new and returning), the number of sessions per user (how many return), pageviews, pages per session, average session duration, and bounce rate.
For some more information on what these terms mean specifically, check out our article on Using Google Analytics for your Pet Store Website (and here’s Part 2).
How to Use this Report for pet Store Marketing:
Are your pages per session low? That could mean that your on-site content isn’t helpful, credible, or “good” enough to build trust from your audience.
Is your bounce rate high? Find out where the majority of your page exits are coming from and make edits to those landing pages. Consider sending traffic to better, higher-converting landing pages.
How many of your users are returning? For pet stores with eCommerce capabilities, having low returning users (or “stickiness”) could be a cause for concern as you are wanting to attract not just any type of customer but loyal customers.
2. Active Users

The Active Users report can help you understand the retention rate of your website. You can analyze how often users are coming back to your website over a certain time period.
One of the best ways to use this feature is to track the performance of a pet store marketing campaign in the last 28 days (basically a month). Since many pet stores operate on monthly schedules with campaigns and deals, it’s a good match. With the Active Uses report, you can see how users engage with your content and how often they return to your website.
How to Use this Report for pet Store Marketing:
If your 1-day active user count and your 28-day user count are the same, then it means your users are engaging and returning. But if the 28-day count is less than the 1-day count, then your on-site content is not engaging or sticky. You need to work on giving users a reason to come back to your website, or the traffic that you’re sending to the site is not qualified!
3. Lifetime Value
The Lifetime Value report lets you understand how valuable different users are to your business based on lifetime performance.
The Lifetime Value report is great for pet stores with primarily eCommerce websites. However, you can also attribute monetary values to conversions like subscribers, memberships, or loyalty system signups. If you have an accurate representation of how much an email subscriber or loyal customer is worth over the span of their patronage, you can input that value into Analytics to improve this data. Here’s a quick breakdown/formula for a loyal pet store customer:
Variable A: Customer shops at the store 1x per month, or 12x per year
Variable B: Customer spends, on average, $35 per visit
Variable C: Store makes an average of 33% profit on purchases

The Formula: A x B x C = Yearly Profit Per Loyal Customer. In this example, 12 x $35 x 33% = $138.6 of profit for the store per year. If the lifetime value of this customer, let’s say they became a customer when their dog was a puppy and they stopped shopping with you when their dog crossed the rainbow bridge, then we take that profit and multiple it by 12 years. $138.6 x 12 = $1,663. There’s your lifetime profit value of a loyal customer.
We use a pretty similar breakdown for our ROI calculator with Pet Engine Marketing clients… so consider this a good look at what goes on behind the scenes here!
How to Use this Report for pet Store Marketing:
When you have this information, you can get an understanding of what the lifetime value is for users acquired through different marketing channels.
Wouldn’t that be incredibly helpful for your allocation of marketing budget and resources? If you knew that the majority of your customers were coming from pet store SEO, but your most valuable and loyal customers were coming from your pet store social media platforms?
4. Cohort Analysis
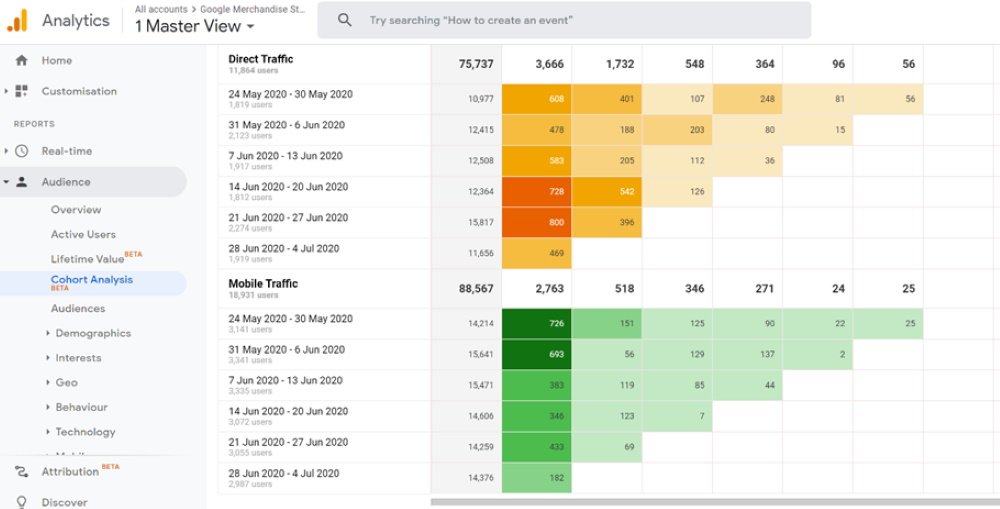
The Cohort Analysis lets you break down visitors into related groups for microscopic analysis. These groups, or cohorts, share a common characteristic (the Metric dropdown) or experience on your website. You can also input segments (different acquisition channels) to study the overlaps and commonalities between them.
Why would you use this?
Because sometimes it’s more beneficial to get a close-up look at one specific, critical part of your audience rather than looking at the entire picture. Analyzing specific segments, instead of your audience as a whole, will give you a clearer idea of what makes a great customer for your business.
Cohort analysis is for the advanced user who doesn’t just look at numbers the total number of users. Cohorts are a way to break those numbers down. If you’ve heard about “vanity metrics,” the cohort analysis is the exact opposite. It does add some complexity, but nobody said that data analysis was easy!
How to Use this Report for pet Store Marketing:
Use the cohort analysis report to analyze a group of users and how they're interacting over a period, combined with their source of acquisition. If Google Ad campaigns are driving a lot of traffic, but they aren’t converting or returning, is that really a good way to spend your hard-earned marketing dollars?
Now segment it by device: are mobile users dropping off in droves? Maybe your website is offering a poor experience to mobile users. If that’s the case, perhaps you want to exclude mobile device ad placement from your pet store social media paid advertising campaigns.
The Cohort Analysis is the analysis of groups of users, comparing one group to another group, helping you identify patterns, trends, and differences.
5. Audiences
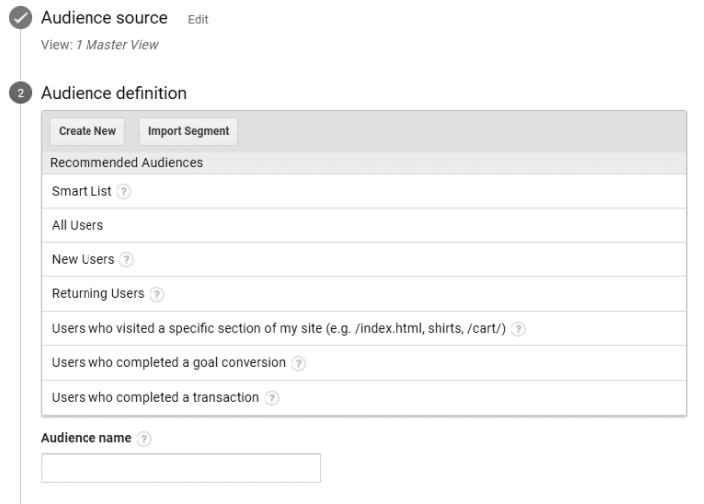
The Audiences tab, within the Audience dashboard (🙄), allows you to analyze the behavior of a saved audience. You can create this audience based on any combination of attributes that might be meaningful to your business. They can be as broad or as specific as you’d like them to be.
Maybe you want to create an audience that targets everybody that has visited your site in the last 90 days. Or maybe you want to create an audience of everybody that has made a purchase on your pet store eCommerce website this year. Or, for a third option, maybe you want to create an audience segment of everybody that has visited your site but hasn’t made a purchase in the last 180 days, excluding people that did make a purchase.
In order to make that audience, you’ll have to go to the “Admin” page of your Analytics, then select “Audience Definitions,” and then navigate to “Audiences.” Hit “+New Audience” and you’re on your way! Luckily, Google has some recommendations to create audiences and make it easier for you.
How to Use this Report for pet Store Marketing:
You’ve identified an audience that performs well in terms of engagement and conversions, and this indicates they’re a valuable audience for your business. Maybe they’re a returning user that visited the “pet foods” portion of your site and completed a purchase. In this case, you’ll want to allocate more marketing budget to ads for these users, and if you aren’t already running a marketing campaign to target these users, it’s time to start.
If an audience is performing well, don’t settle for “good enough!” Put some gasoline on the fire and double down on the data and insights. You can also create “similar audiences” to expand your campaign targeting to include users that exhibit similar characteristics to your starting audience. With this feature, you can expand your overall reach and convert new, similar users into paying customers.
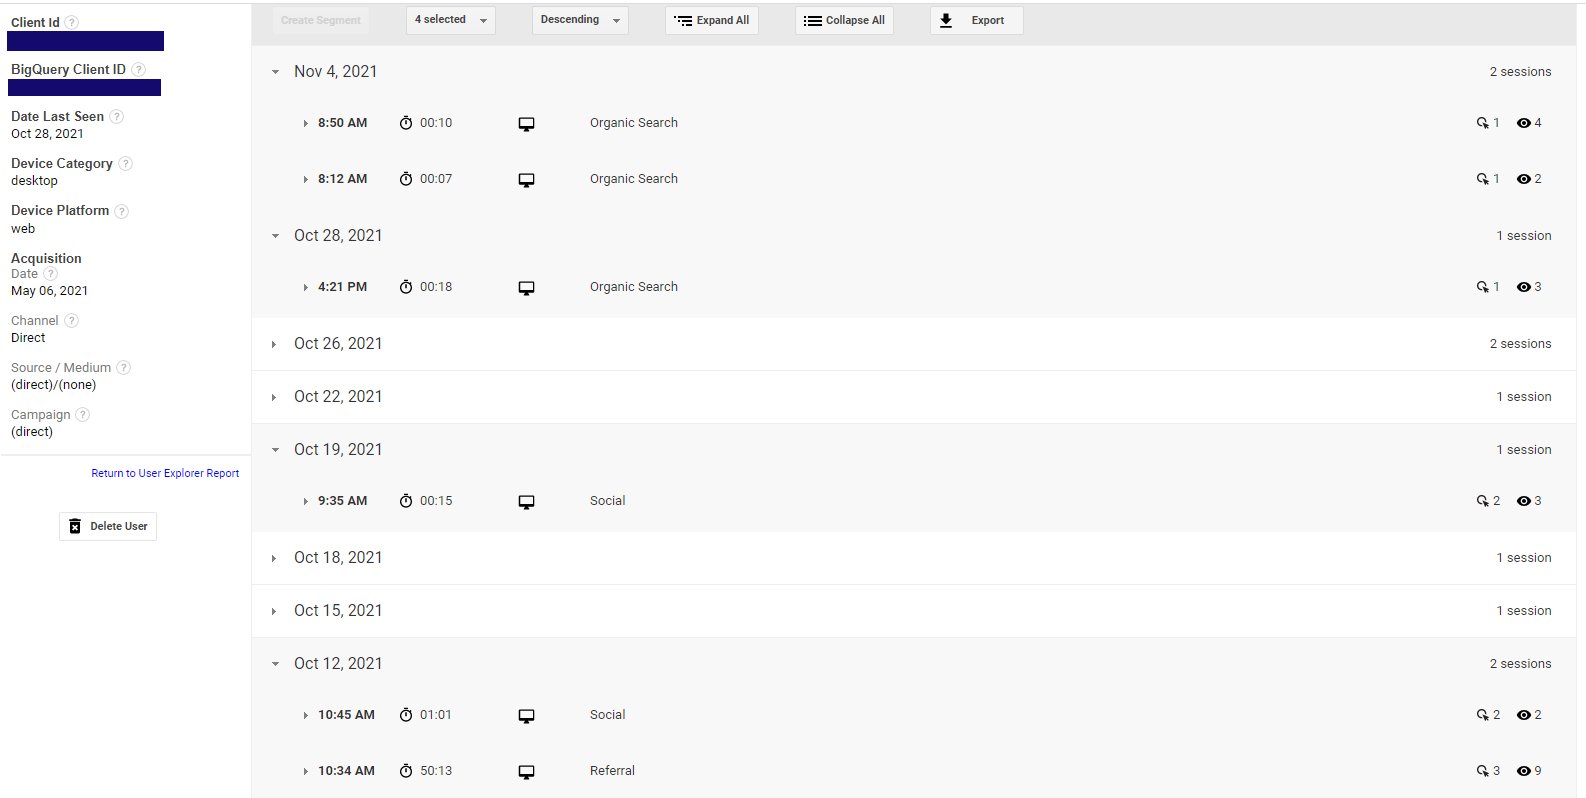
6. User Explorer
The User Explorer area gives you the option to isolate and examine individuals rather than aggregate user behavior. Individual user behavior is associated with either Client ID or User ID, so it stays anonymized (from an age/gender standpoint) but you can still look at the number of sessions, session duration, bounce rate, revenue, and conversion rate.
At this point, you might be thinking “this is way more than I need,” and that may be true, but the User Explorer does still serve a purpose that could be beneficial to your pet store marketing campaigns.
How to Use this Report for pet Store Marketing:
With the User Explorer report, you can understand the journey of people that make a purchase or complete a goal conversion. Sort the report by revenue or goal conversion rate and then look into a specific user’s journey to becoming that client. Understand exactly where they came from, what they did on the site, which page they spent the longest on, and then work to replicate these touchpoints within the customer journey.
7. Demographics
The demographics section breaks down your website visitors by age and gender. Gender is simplified into M/F and age is broken down into six subcategories:
18-24
25-34
35-44
45-54
55-64
65+

You can access additional details within the Demographics dropdown on Age and Gender, breaking each category into segments and comparing them with other custom audiences or segments, tracking their average on-site behavior, and getting data as to how these traffic groups are applied.
How to Use this Report for pet Store Marketing:
There are a number of easy ways that the demographics data can be used to improve your pet store marketing campaigns. You might have a preconceived notion of who you think your ideal customer is, but the data says otherwise. For pet stores that also have an eCommerce store, your average or loyal in-store customer may have significant demographic differences from your online customers.
Creating campaigns, messaging, and ads that are specific to age/gender combinations will increase the likelihood of yielding conversions or revenue from them as you hone in on your target market.
8. Interests
Wondering what else your customers are into? With Google’s ability to track users nearly anywhere and everywhere on the web, they are able to pool your visitors into categories based on their interests.
There are three subcategories under the Interests section:
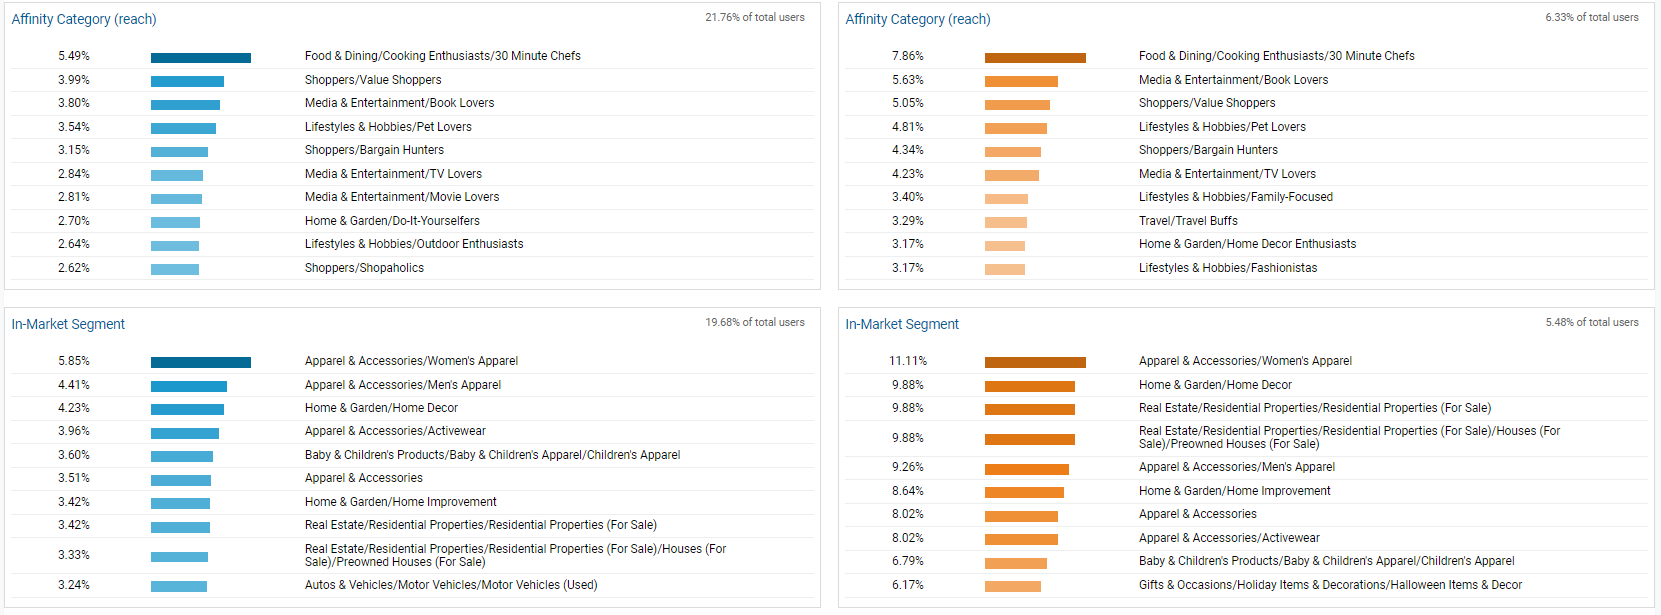
Affinity Category — Affinity categories can be used to reach prospects or potential customers and build awareness of your brand, product, or store. Typically these users are higher in the purchase funnel (further away from conversion).
In-Market Segment — Your in-market segment consists of users that are showing purchase intent. These users are lower in the purchase funnel, closer to the end of the process.
Other Category — These are more granular categories than Affinity or In-market, and let you identify users who are not in those other categories. This group is based on the other users’ browsing data.
Not to beat a dead horse here, but like many things in Google Analytics, you can get better data the more you drill down. Your basic Interests information can be helpful, but it won’t supply the entire picture.
How to Use this Report for pet Store Marketing:
In our experience working with pet stores, the primary audience is generally female. So let’s take our interest data and segment it by gender, and then segment it by age to include our three highest age groups: 35-44, 45-54, and 55-64.
You can now see that the demographic data of our segment has some differences, specifically at the top, from our general data. For this particular pet store, real estate (in the in-market segment) has a higher percentage than the general data. Maybe there’s a partnership to be found between this pet store and local realtors, or other ways to get in front of people looking to buy a home. If you’re in a high-growth area, maybe you want to throw a “Welcome to the Neighborhood” pet store event to bring everybody together!
9. Geo

The Geo section covers the languages and locations of website visitors. You might be surprised by what you find here!
This is a fairly standard section: the Language and Location categories both have charts for acquisition, behavior, and conversions data. However, the Location subsection also contains a nice map that can visually display your visitors’ locations.
How to Use this Report for pet Store Marketing:
Particular effective for eCommerce businesses or businesses that don’t have a brick-and-mortar location, this information can help you in geotargeting for your pet store social media and pet store search engine marketing campaigns.
You can create content that’s locally focused and includes area influences, landmarks, or messaging.
The data that you find in the geo section can also help you remove some segments from your audience so that the rest of your data doesn’t get skewed. For example, let’s envision that at the end of the month you’re seeing that your website traffic was up 88%. That’s exciting, right?! You dig a little bit deeper and find that 95% of that increase in traffic originated from overseas and the average time spent on your site for that segment of the audience was 1 second. If you hadn’t looked further, you might have been misled into thinking that whatever else you were doing that month, good or bad, was getting you a boost in traffic.
10. Behavior
The Behavior section in Google Analytics provides valuable reporting data on:
New vs. Returning Visitors
Frequency & Recency
Engagement.
With this data, you can measure the gravitational pull of your site, and the extent to which you’re encouraging new visitors to become frequent, returning visitors.

How to Use this Report for pet Store Marketing:
With the data in the Frequency & Recency report, you can get an idea of the timelines and cycles that your best customers are on as it pertains to making online purchases from your pet store. If you know that, on average, your customers visit your site every 14 days, you can infer that the products they purchase are running out every 2-4 weeks. From there, maybe you want to set up an auto-ordering process that they can sign up for to make the purchasing process more convenient for them and you!
With the Engagement report, you can understand how long, on average, your converting customers are staying on the site. How long does it take for that conversion to happen? If you’re driving traffic through a campaign to a specific site and seeing that the majority of your traffic is falling off after 0-10 seconds, then you have issues with the landing page conversion or the quality of the traffic being driven there.
11. Technology
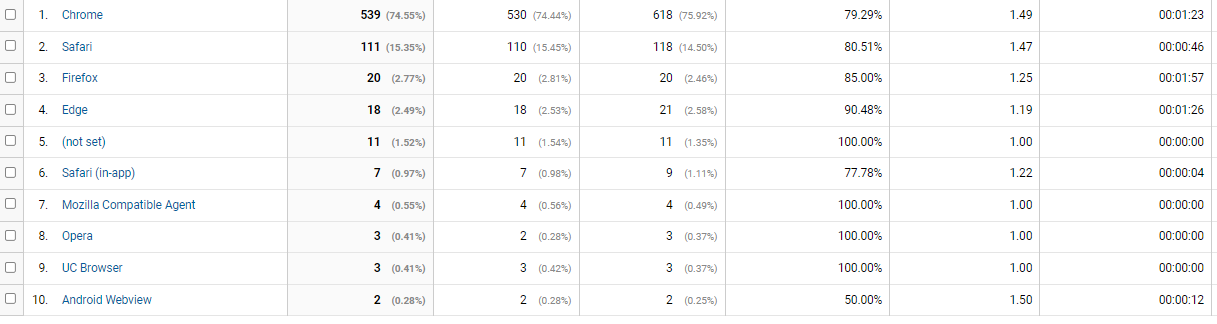
Your Technology reports in Google Analytics help you learn about what browsers, operating systems, and Internet Service Providers (ISP) your website visitors are using. What browsers are people finding or visiting you on?
As you can see from the data, the majority of the visitors on this example are using Chrome, with Safari and Firefox bringing up second and third, respectively.
You might be wondering - what good is that information? Who cares how they’re visiting my site? It’s a fair question.
How to Use this Report for pet Store Marketing:
There are a few different ways that you can use this data to help you. The first is as it pertains to your pet store website and your pet store SEO.
Sometimes websites can optimize differently based on your browser. Optimizing for the majority of your users will create a better experience for them, and help your organic search rankings and lower that bounce rate!
Second, what can you learn about your audience based on how they’re visiting you?
Chrome and Firefox users tend to be early adopters (people that are first to use new technology), and this could suggest that your audience is tech-savvy, or younger. It might confirm some of your beliefs or support your data and insights.
Safari is frequently used on iPhones and other Mac devices. You could make deductions on the socioeconomic status of your audience based on that data.
Are you surprised at the number of users on Edge or Internet Explorer? Those visitors may be part of an older demographic.
12. Mobile
In today’s world, how important is it to optimize your pet store website for mobile viewers?
In 2021, mobile phones generate 54.25% of the traffic, desktops – 42.9%. 55% of page views in 2021 come from mobile phones.
Source: TechJury
Answer: SUPER important!
The Mobile report on Google Analytics offers data and insights on what devices people are using to visit your site: mobile, desktop, or tablet.

How to Use this Report for pet Store Marketing:
What can we infer about our audience based on their mobile device, and how can that influence our campaigns?
Well, first, if people are primarily visiting you on a desktop, you might be able to deduce that they are visiting your website from work. If the majority of your traffic is on mobile, maybe they’re on the go. How much of your organic search traffic is coming from mobile or desktop devices?
If you have an overwhelming number of mobile visitors, maybe it’s time you thought about creating an app for your business! Or if you can’t afford an app, maybe you want to run a social media campaign that limits ad placements to mobile devices.
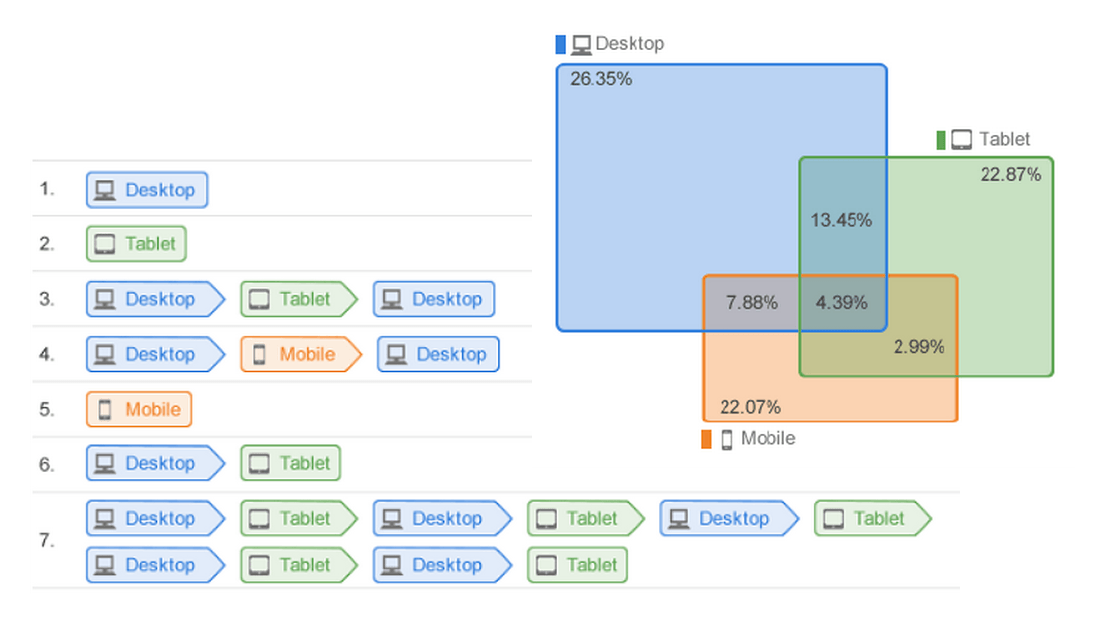
13. Cross Device
The Cross Device report is a Beta feature (as of the time of this article being published!) that provides tools to organize data across multiple devices into a more cohesive analysis. This should result in data on how seemingly unrelated touchpoints, sessions, interactions, and visitors are connected.
Your Cross Device report has to be set up and launched within Analytics through a tool called Google Signals. Enable that so that you can begin collecting this data and connecting the dots.
How to Use this Report for pet Store Marketing:
Let’s imagine that we have a pet parent, Eliza, and their dog’s leash just broke. They need a new leash ASAP.
Eliza opens Safari on her iPhone and types in “dog leash.” She ignores the Chewy & Amazon shopping ads because she needs the leash today. Eliza finds your website because your pet store SEO is on point and you’re on the first page 😉.
Eliza then visits your site and picks out a leash, but can’t purchase it because she doesn’t have her credit card handy. So Eliza waits until she gets home and then hops on the computer, types your pet store’s website directly into the browser, and purchases the leash to be picked up in your store from her desktop computer.
Without the Cross Device report, Google Analytics would track this as two separate sessions (phone, and then computer) and attribute that conversion to a desktop user that found you by direct traffic. You might think that this customer already knew about your store and maybe shopped there before.
However, that isn’t the entire picture of the customer journey, is it? Eliza initially found you from an organic Google search and then purchased the product after finding you directly.
Connecting those dots gives you a better idea of your customer’s behavior, where your conversions are coming from, and how you’re gaining new customers. This data can help you decide where to allocate your time and efforts on your pet store marketing campaigns.
14. Custom
Ready to get deeper into Google Analytics? Ha ha…
Your Custom reports are even more advanced than your standard reports — we’ve been covering the standard reports so far!
With Custom reports, you have to define your own variables, metrics, and dimensions. You need to create these dimensions in your Admin settings and then connect the data with to Google Analytics through Google Tag Manager, before adding JavaScript to your website.
This is a fairly complicated process, but there are tutorials that you can follow online.

How to Use this Report for pet Store Marketing:
Let’s say you’ve put together some user personas that describe your primary audiences. Here’s an example:
Eliza the Suburban Dog Mom: Eliza is a pet parent, is between the ages of 25-44, lives within 10 miles of the store, and also has some additional interests in home and garden, real estate, healthy eating, and value shopping.
Now, not every visitor to your pet store’s website will fit this persona. And you can’t just ask visitors if they fit this persona either. However, you can begin to track this specific type of customer as they enter your funnel and visit your website. You can create a social media campaign targeted at this persona specifically.
15. Benchmarking
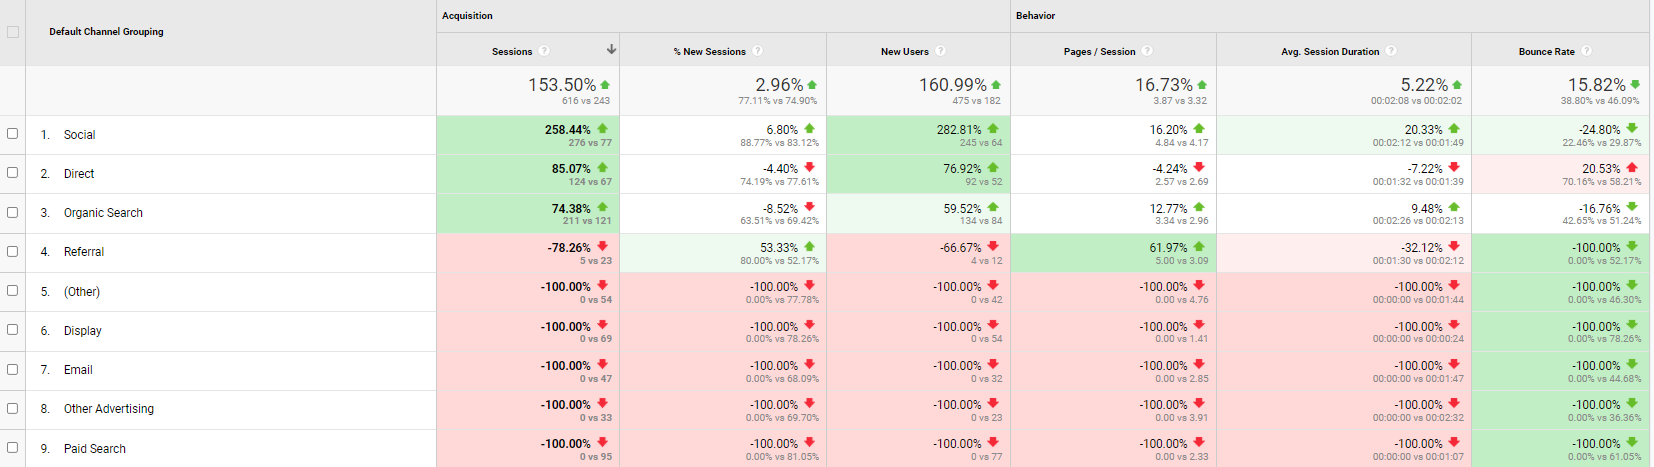
The Benchmarking report from Google Analytics allows you to see how your website is trending based on your industry. Your benchmarking reports include three types of reports.
Industry Vertical
Country/Region
Size by daily session
Adjust these filters to find the right niche for your traffic comparison. Make sure that benchmarking is enabled in your account settings!
How to Use this Report for pet Store Marketing:
Take a look at how many web properties Google can find based on your filters. That’s how many competitors you’ve got!
You can get a decent look at where you rank up against your competitors through this report. Your traffic channels that are performing above industry standards are in green, while the ones below the rest of the industry are in red.
If you want your store to be as profitable as the one across town, you can get an idea of what the benchmarked metrics are: how much more organic traffic do you need? Are you weak in social media traffic compared to others? What about your pet store email marketing campaigns, how do those rank up?
Make sure to add context to your benchmarking data! Why would your site or traffic be above or below industry standards? Based on these metrics, how critical is it that you pivot to adjust that? Have you prioritized one channel above another, strategically or not? Are your campaigns or providers as effective as they should be, given your expense?
16. Users Flow
You’ve made it this far, and you’ve made it to one of the Audience dashboard’s most useful reports: users flow!
Your Users Flow report shows you the flow of users through your website based on language, location, browser, mobile device, and other dimensions. You can also add custom segments to understand how they go through your site as well.
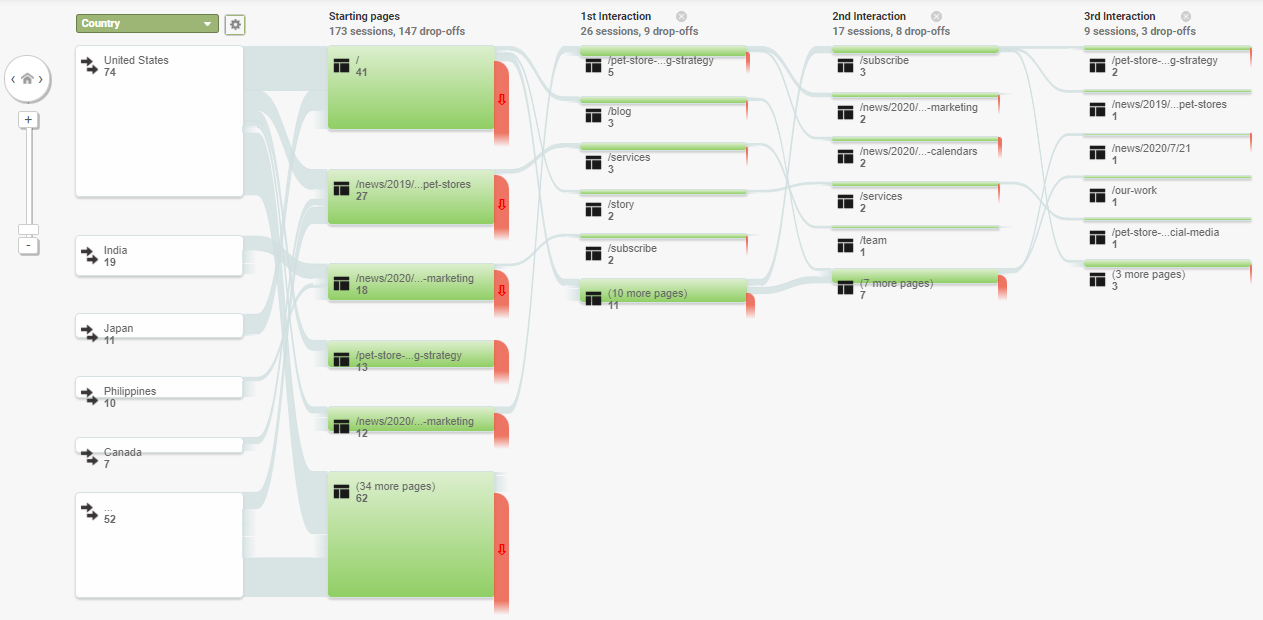
How to Use this Report for pet Store Marketing:
Wondering where customers fall off in their journey? The Users Flow report helps you do that.
Find out which pages encourage others to visit other pages on your website - there’s a starting point and a blueprint for higher-converting, more engaging pages.
When visitors navigate your site easier and find the products or information they’re looking for, the happier they’ll be and the happier Google will be. You gain a deeper understanding of how your visitors interact with your pages, thus allowing you to optimize your website and pages for more conversions, and more sales.
Use Google Analytics Audience Data
to Improve Your Marketing
As you can tell, there are about a thousand ways in the Audience dashboard alone that you can use to learn about your visitors. What do you think? What have you learned by taking a deeper look into your audience data? Share some insights, surprises, questions, or thoughts below, or join our Facebook Group to get some additional help or feedback! Looking forward to hearing from you.